Introduction
The aerOS Embedded Analytics Tool (EAT) can be compartmentalised into three roles; these are the analytics framework, function authoring and visualisation. This section will reiterate these primary roles to provide a final architectural view of EAT with additional detailing of the aerOS Function Template structure. As a result, a holistic EAT architecture is presented. ..
- width:
480
- alt:
Embedded Analyics Tool Architecture
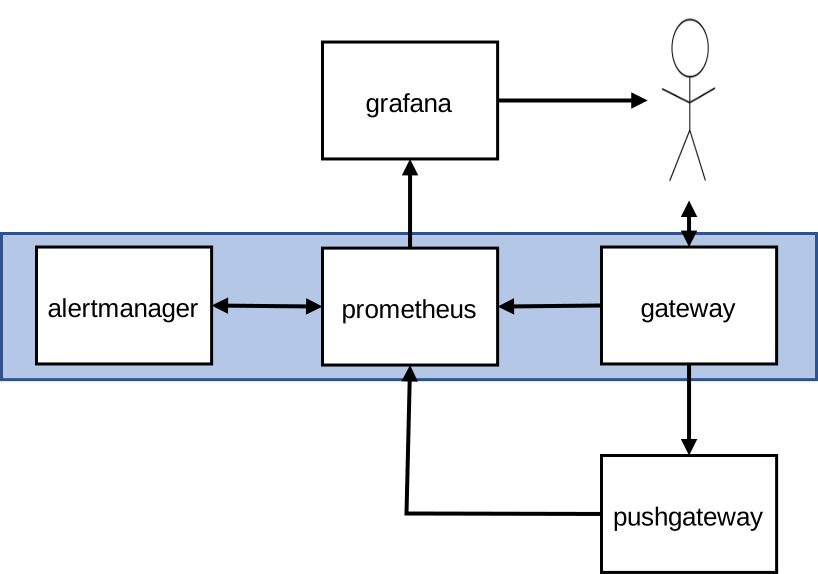
EAT provides a framework for the design, implementation, and deployment of specialised functions. These may be straightforward policy-based functions for validation use cases or intelligence-based models for smart decision making. The framework supports multiple dashboards for operations (gateway) and visualisation (grafana). The pushgateway allows in-function metrics to be exposed to prometheus monitoring which is then visualised through grafana to the user. The alertmanager component monitors prometheus metrics related to the health of the gateway, alerting the user if required. All these components are hosted on the aerOS Gitlab and are installed as nodes in a Kubernetes cluster through helm charts. To access these features of EAT, functions must be created using the aerOS template.
Features
Place in architecture
User guide
The aerOS template details the two layers of the function template. The first layer contains information specific to how the function interacts with EAT. ..
- width:
480
- alt:
Structure of EAT Function

This includes the image build file (Dockerfile), what libraries Docker needs to compile the function image (requirements) and the wrapper used to interface with the function (index). The second layer contains information specific to the function operation. The init component contains operations to carry out when the function is deployed, this includes building the grafana dashboard where in-function metrics will be visualised. The handler component contains operations to carry out when the function is triggered, such as a policy or intelligence-based decision making. The metric_reporter component contains operations for exposing in-function metrics to prometheus. These metrics can then be visualized through the dashboard instantiated when the function was deployed. The requirements component contains required libraries for handler executions. The aerOS template must be used to create EAT functions, this process is handled through the faas-cli application.
The steps involved from the creation to the deployment of EAT functions is shown in the figure above. The faas-cli application allows users to create EAT functions using the aerOS template. The application also enables the build, push, and deployment of functions to EAT. Build packages the EAT function as a Docker image and stores the image locally. Push allows the user to specify a container registry to store the image. Deploy takes an image, either locally or from a container registry and onboards the image as a node in the Kubernetes cluster. This allows users to dynamically deploy and update functions as versioning can be controlled at deployment. Interfaces between EAT and other aerOS components can be viewed on two levels. The first level is the interface provided by EAT for the function i.e. REST, this interface is triggered through a HTTP request which provides a body that is passed into the function handler. The second level is interfaces established inside the function, such as queries to the Data Fabric or pushing metric to prometheus. Both interfaces are available to users however the execution of a function will always require a HTTP request to trigger and a response to signify the execution has concluded. The installation of EAT comes with three prepackaged functions, these functions provide generalised stratified sampling, anomaly detection and data drift detection based on Data Fabric models. These functions may require minor edits on an ad hoc basis, depending on the complexity of data models being used.
faas-cli Application
The faas-cli application is required to create, build and deploy functions from CLI. This code will download faas-cli version 0.16.7 which has been used throughout EAT development. Depending on your machine you may need to add permissions or move the downloaded faas-cli to a different directory for it to become executable.
chmod +x get-faas-cli.sh
./get-faas-cli.sh
Function Creation
To create an aerOS function for the Embedded Analytics Tool, you must create it from our aerOS function template. The following function uses the faas-cli application to create a new function called “stratified-sampling”. The –lang parameter specifies our aerOS template. The –prefix parameter specifies an image registry to push and pull the image from.
faas-cli new example-function --lang aerOS-python3-flask --prefix registry.gitlab.aeros-project.eu/wp4/t4.4/embedded-analytics-tool
However if you wish to use scikit-learn libraries a unqiue template is required as shown here:
faas-cli new example-function --lang aerOS-python3-flask-scikit-learn-build --prefix registry.gitlab.aeros-project.eu/wp4/t4.4/embedded-analytics-tool
Add Secret
To ensure your functions can be pulled from project registry you must modify the function YML file to include the registrypull secret, see below:
version: 1.0
provider:
  name: openfaas
  gateway: http://127.0.0.1:8080
functions:
  stratified-sampling:
    lang: aeros-python3-flask
    handler: ./stratified-sampling
    image: registry.gitlab.aeros-project.eu/wp4/t4.4/embedded-analytics-tool/stratified-sampling:latest
    secrets:
      - registrypullsecret
Function Deployment
faas-cli provides an “up” operation which couples the building, pushing and deployment of a new function. To deploy our function to the Embedded Analyics Tool, this operation should be used as it ensures all versions of your function, local/registry/deployed are the same.
faas-cli up -f example-function.yml -e GRAFANA_USER=$GRAFANA_USER -e GRAFANA_PASS=$GRAFANA_PASS
Common Issues
Below are common issues faced when working with functions accompanied by fixes:
Docker login
If an unauthorised exception is triggered it may be related to Docker login. This can be fixed by logging into the container registry.
docker login registry.gitlab.aeros-project.eu -u $USERNAME -p $GITLAB_TOKEN
Crashed Functions
If your function crashes after deployment you can check function logs.
kubectl logs example-function-564b5cd49-cx22k --namespace openfaas-fn
Grafana Dashboards
If you have exported your dashboard from Grafana and are receiving a bad request error from REST POST this is often because your id fields are not set to null, Grafana API will assign these ids when processing the call.
Depolying Functions through Helm
If you wish to package your functions with the EAT installation or deploy functions through an orchestrator/policy instuctions can be found on the OpenFaaS website: https://www.openfaas.com/blog/howto-package-functions-with-helm/
Prerequisities
The installation of Embedded Analytics Tool (EAT) utilises helm charts to define and depoly the containers which make up EAT. These charts establish interfaces between containers working together to provide full EAT functionality.
Installation
The first step in installation is to clone EAT from the aerOS GitLab repository and then step into the folder using the change directory command.
git clone https://gitlab.aeros-project.eu/wp4/t4.4/embedded-analytics-tool.git
Export varibales for Gitlab username, access token and email
export USERNAME=gitlab_username
export EMAIL=yourgitlab@email.com
export GITLAB_TOKEN=accesstoken12345
Next, if installing EAT onto a Windows machine for testing. We support the installation for EAT onto Kubernetes in Docker (KinD). This step can be skipped if installing onto existing Kubernetes cluster. These steps ensure the context is using kind-kind and concludes by printing the cluster information.
chmod +x kind-with-registry.sh
./kind-with-registry.sh
kubectl config use kind-kind
kubectl cluster-info
Before installation of the helm charts we must create the required namespaces for EAT and its functions.
kubectl apply -f namespaces.yml
To access the images which comprise EAT you must create a secret using the gitlab access token. Please request this token from LMI. This is a required step. Without the access token you cannot access EAT images.
kubectl create secret docker-registry registrypullsecret --namespace=embedded-analytics-tool --docker-server=https://registry.gitlab.aeros-project.eu --docker-username=$USERNAME --docker-password=$GITLAB_TOKEN --docker-email=$EMAIL
Next step into the chart folder using change directory command. Three helm installs are executed for the embedded-analytics-tool namespace, these are for OpenFaaS, PushGateway and Grafana. You can check the successfull creation of the pods using the get all command.
cd chart/
helm install --namespace=embedded-analytics-tool -f openfaas/values.yaml  myopenfaas ./openfaas
helm install --namespace=embedded-analytics-tool -f prometheus-pushgateway/values.yaml mypush ./prometheus-pushgateway
helm install --namespace=embedded-analytics-tool -f grafana/values.yaml mygrafana ./grafana
kubectl get all --all-namespaces
To provide access to the GUIs of the OpenFaaS gateway, Prometheus and Grafana the ports must be expose to your local machine. This is achieved through port forwarding. The execution below can be used to achieve this on your machine, if deployed in a production style environment consult the administrator.
kubectl port-forward --namespace=embedded-analytics-tool svc/gateway 8080:8080 &
kubectl port-forward --namespace=embedded-analytics-tool svc/prometheus 9090:9090 &
kubectl port-forward --namespace=embedded-analytics-tool svc/mypush-prometheus-pushgateway 9091:9091 &
kubectl port-forward --namespace=embedded-analytics-tool svc/mygrafana 3000:80 &
To access the GUIs you must provide authentication for both the OpenFaaS gateway and Grafana. This execution retrieves the secret for OpenFaaS gateway and uses the OpenFaaS CLI tool to login to the gateway. This is required if you wish to create and deploy functions on the EAT.
OPENFAAS_USER=$(echo admin)
OPENFAAS_PASS=$(kubectl get secret --namespace=embedded-analytics-tool basic-auth -o jsonpath="{.data.basic-auth-password}" | base64 --decode; echo)
echo -n $OPENFAAS_PASS | faas-cli login --username admin --password-stdin
echo $OPENFAAS_PASS
Grafana requires its secret for login, this can be retrieved with the command below.
GRAFANA_USER=$(echo admin)
GRAFANA_PASS=$(kubectl get secret --namespace=embedded-analytics-tool mygrafana -o jsonpath="{.data.admin-password}" | base64 --decode ; echo)
echo $GRAFANA_PASS
Both GUIs usernames are set to admin by default.
To clean up all EAT related executions the following commands removed all EAT pods, services and helm installs. Helm install is retriggered and all pods/services are printed to screen.
kubectl delete --all deployments --namespace=embedded-analytics-tool
kubectl delete --all services --namespace=embedded-analytics-tool
helm delete --namespace embedded-analytics-tool myopenfaas
helm delete --namespace embedded-analytics-tool mypush
helm delete --namespace embedded-analytics-tool mygrafana
helm install --namespace embedded-analytics-tool -f openfaas/values.yaml  myopenfaas ./openfaas
helm install --namespace embedded-analytics-tool -f prometheus-pushgateway/values.yaml mypush ./prometheus-pushgateway
helm install --namespace embedded-analytics-tool -f grafana/values.yaml mygrafana ./grafana
kubectl get all --all-namespaces
This completes the installation of EAT.
Configuration options
Developer guide
License
This component is licensed under the MIT License.